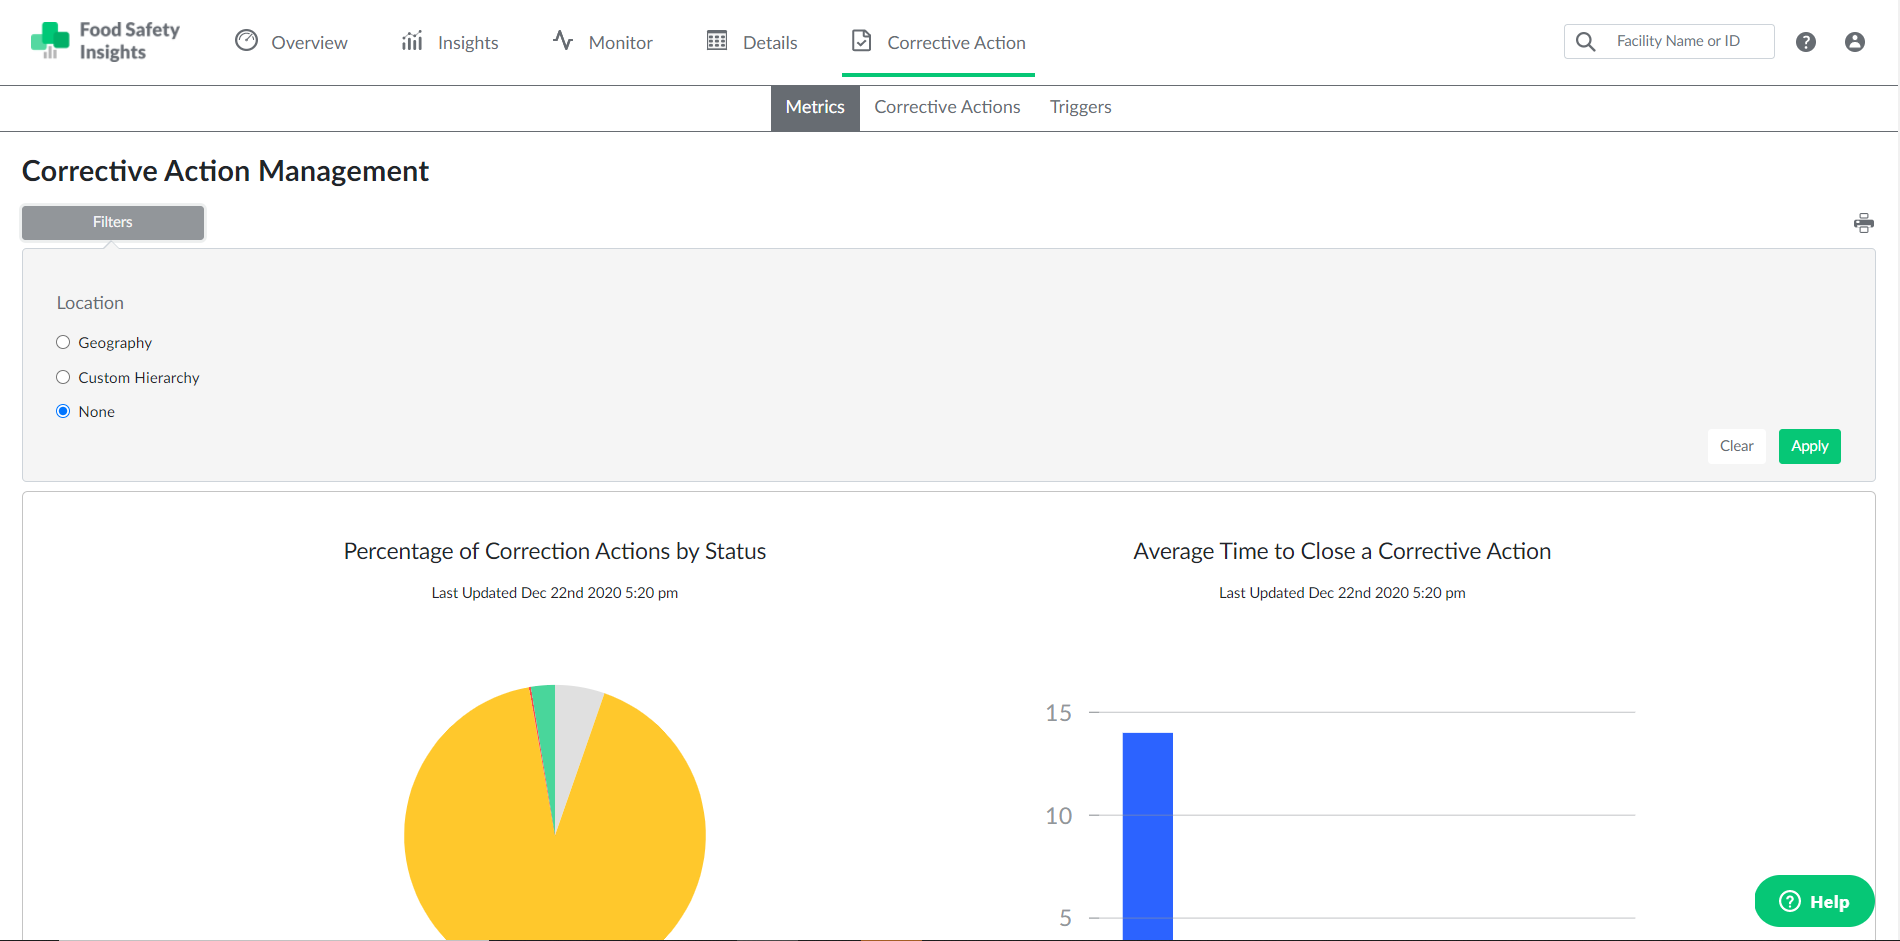
The Metrics page in the CAM module is a quick and easy way to monitor the status and lifecycle of your corrective actions at a glance.

The Percentage of Corrective Actions by Status graph shows a breakdown of corrective actions grouped by status (Open, Closed, Overdue, Unassigned). This chart includes all corrective actions from the past 12 months.
The Average Time to Close a Corrective Action graph provides a visual run-down of the lifecycle of your corrective actions, which is the time that has elapsed from the assignment of a corrective action to completion. Corrective action lifetimes are grouped in weekly increments (e.g., 0-7 days = 1 week; 8-14 days = 2 weeks). This graph includes all corrective actions from the past 12 months.
You can sort and filter the results of both graphs by selecting the "Filters" button in the top left, followed by toggling the provided location/hierarchy filter options. Both charts will then be updated to show only data from the desired locations.