The Insights Module allows for interactive data exploration and analysis through powerful filters and visualization tools.
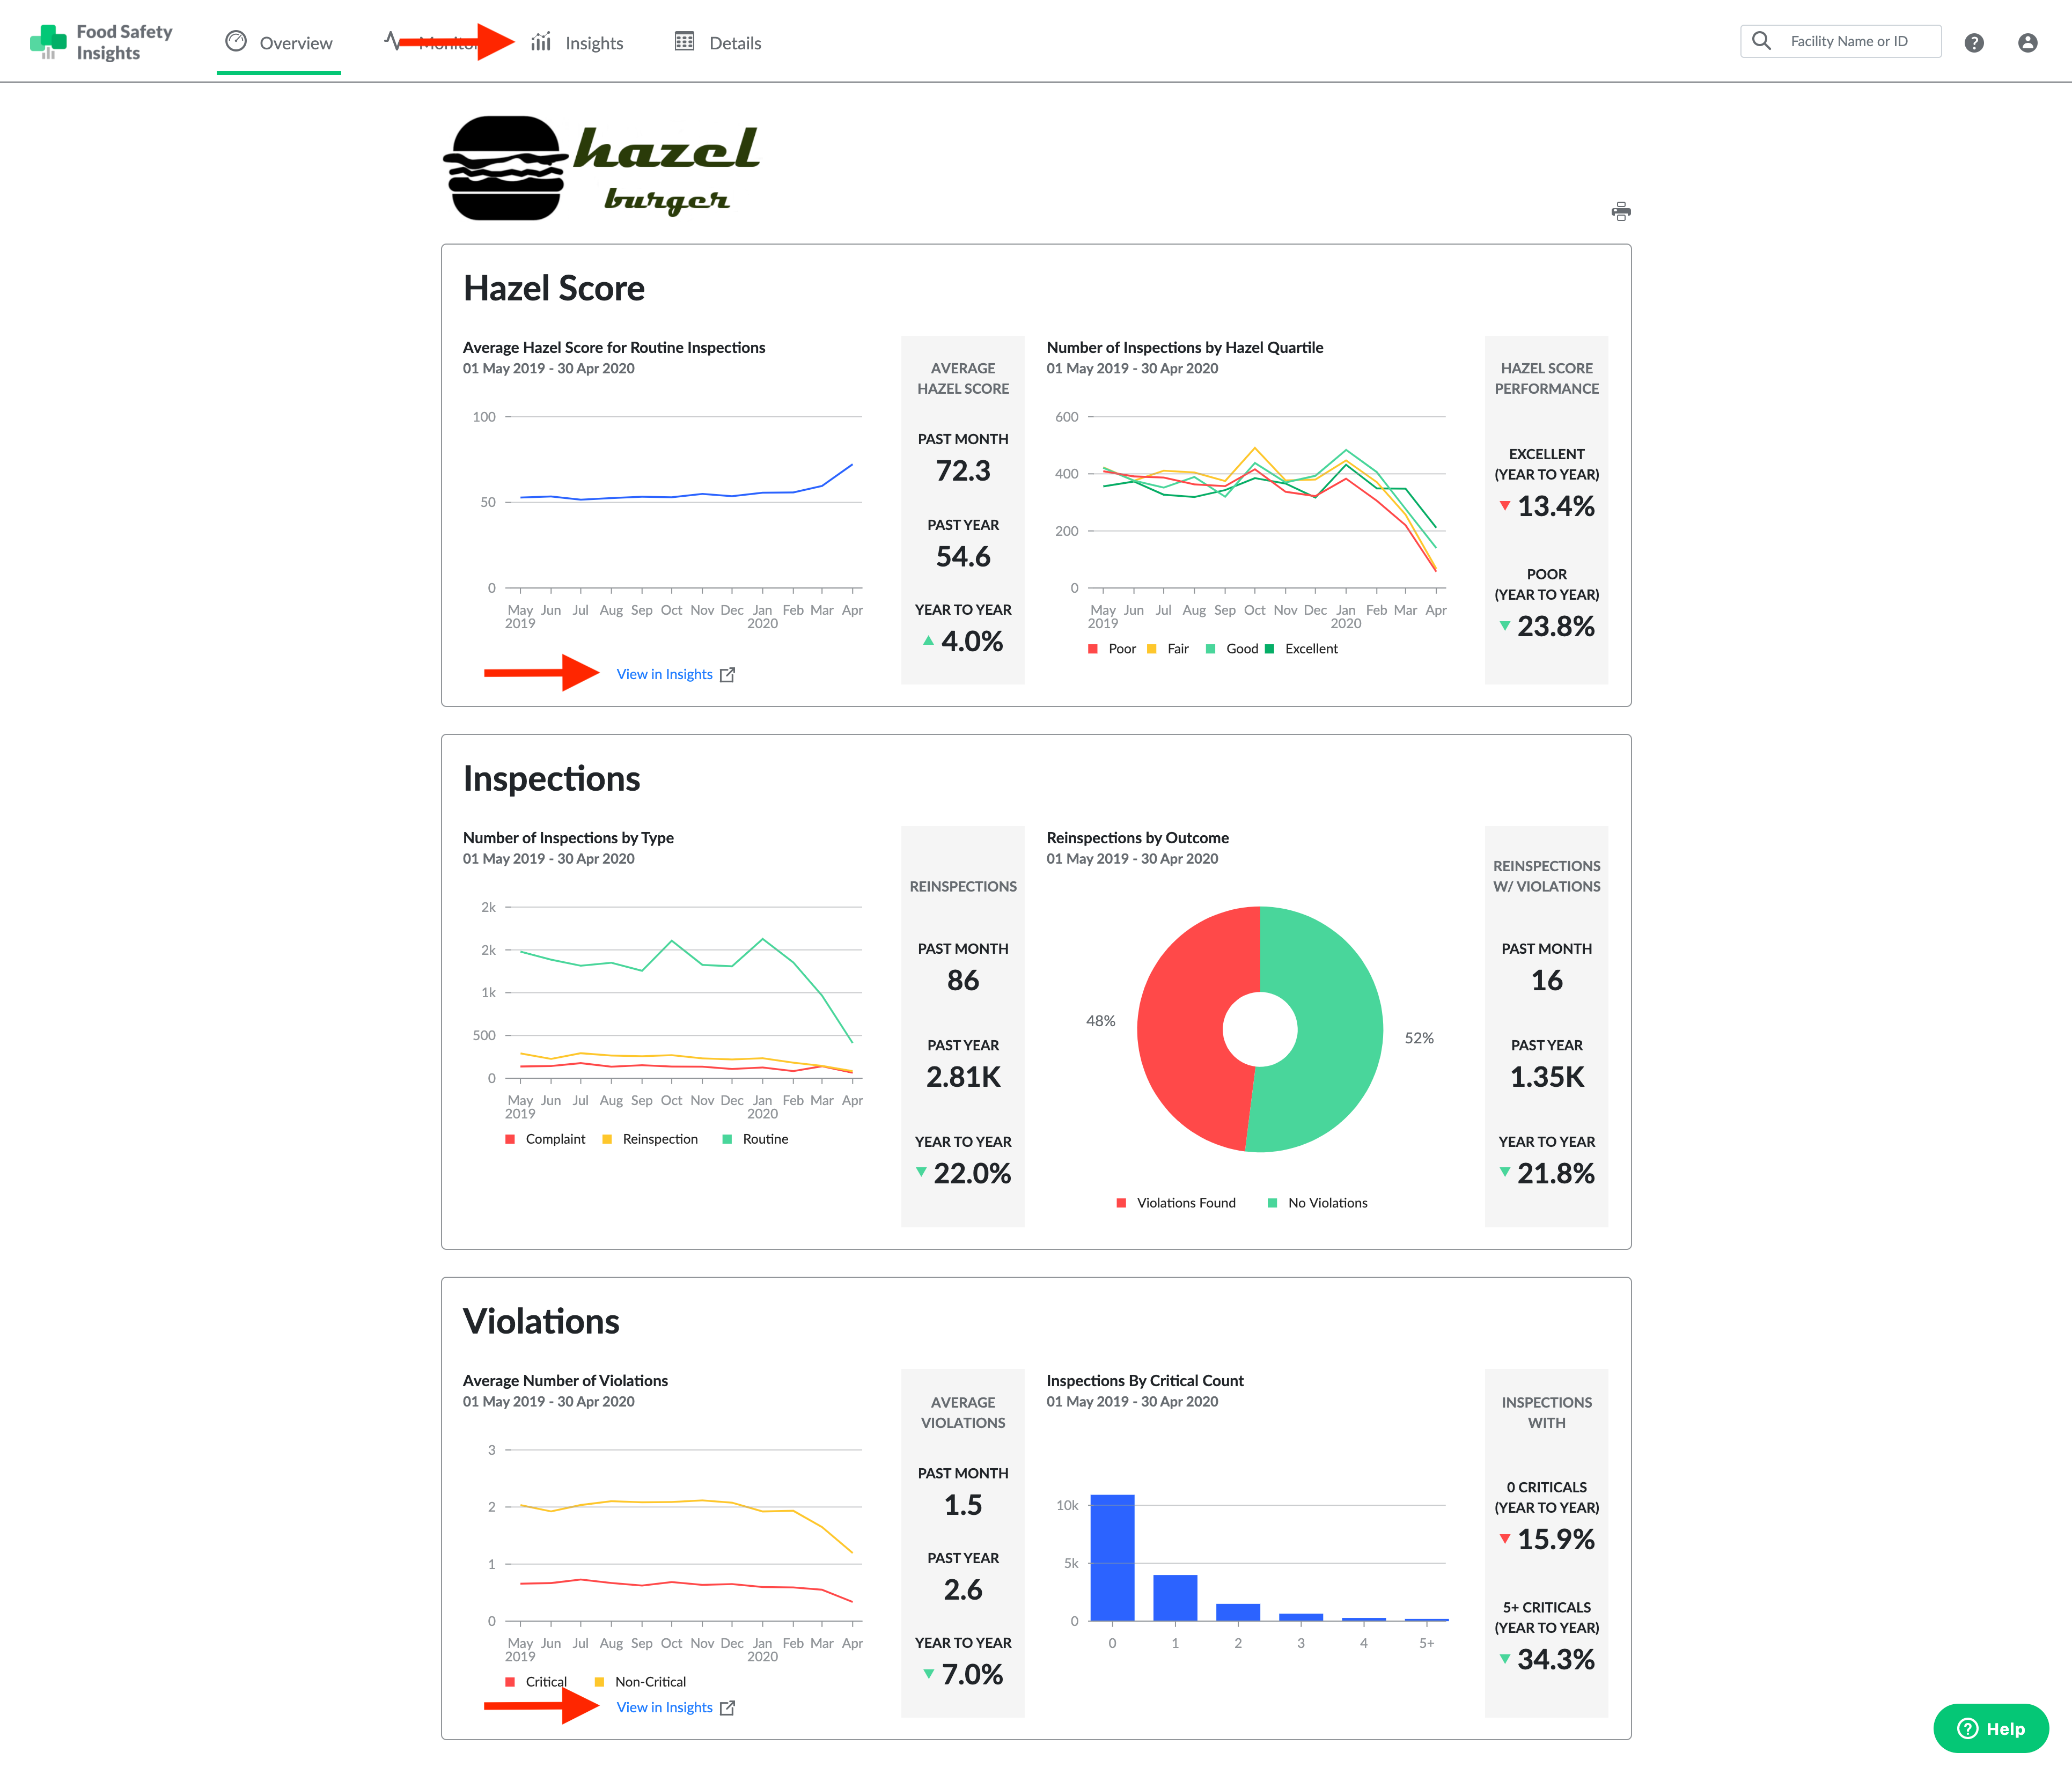
You can enter the Insights Module by clicking the "View in Insights" link below select Overview charts or by navigating to the Insights tab in the top navigation bar.
Grouping vs. Filtering
There are two main tools for creating an Insights chart - grouping and filtering.
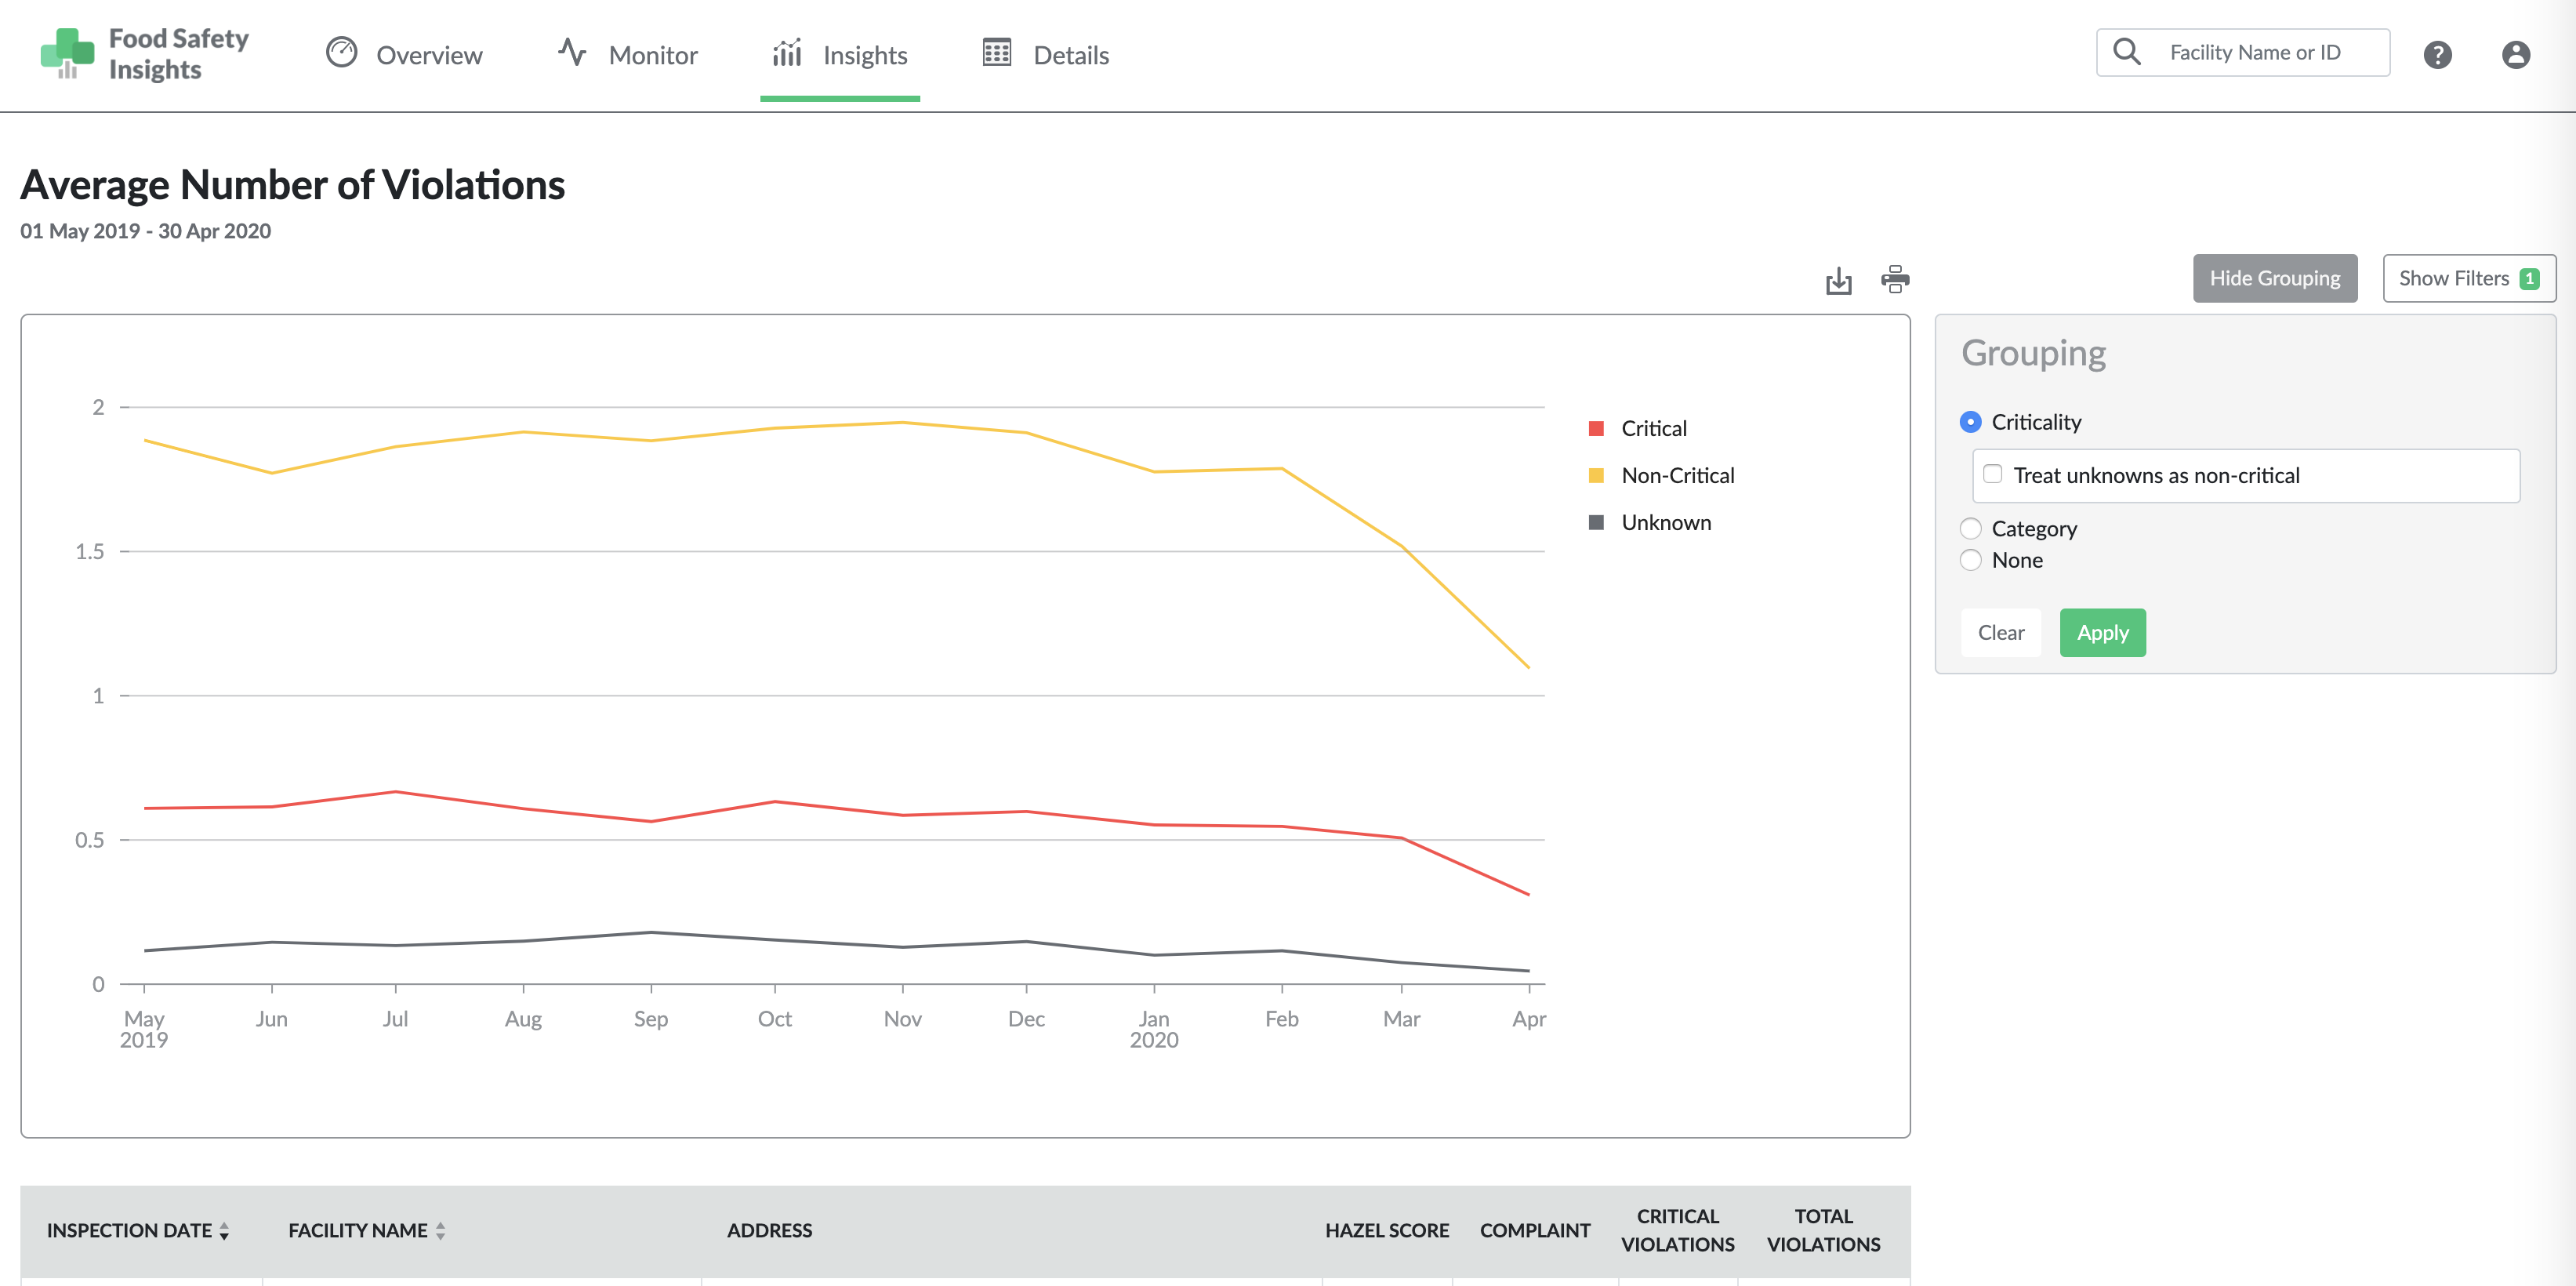
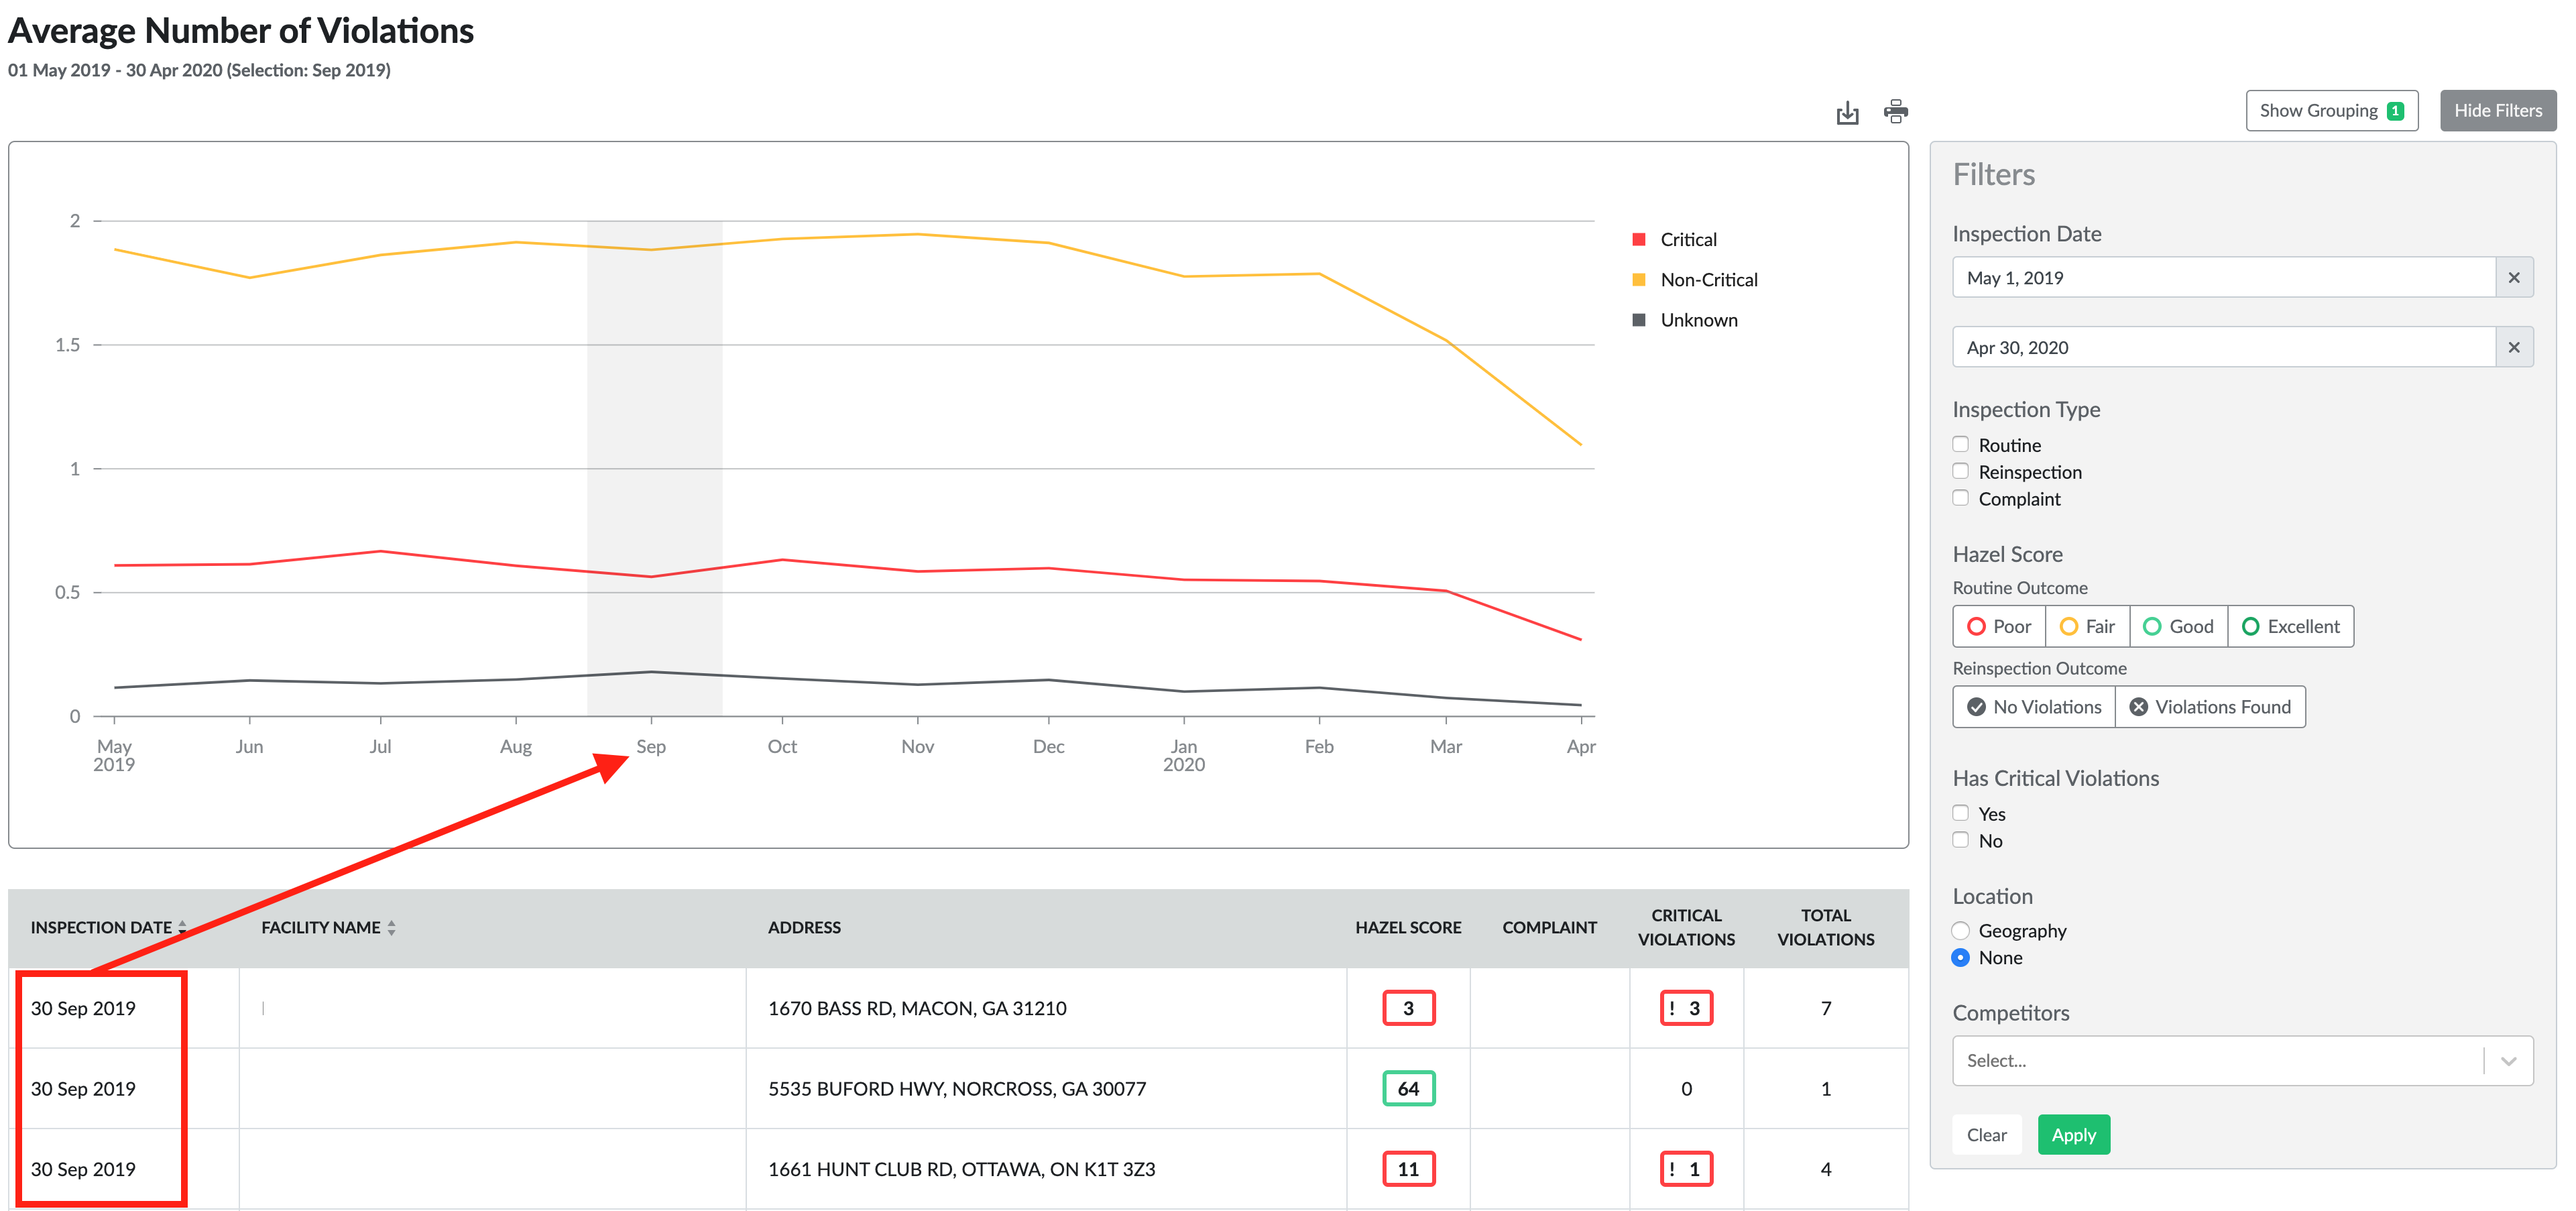
Grouping is available in the Average Number of Violations chart. The Grouping panel allows you to pick which data attribute to view on the chart. For the Average Number of Violations chart, the options are are to group by:
- Criticality - this chart shows data series for critical violations, non-critical violations, and unknown violations.
- Category - this chart shows data series for the 5 Hazel violation categories.
- None - this chart shows a single data series for total number of violations.
Filtering is available in both the Average Hazel Score and Average Number of Violation charts. The filter panel works just like the filter panel in the Details module, and allows you to exclude inspections from your Insights chart based on the criteria you select.
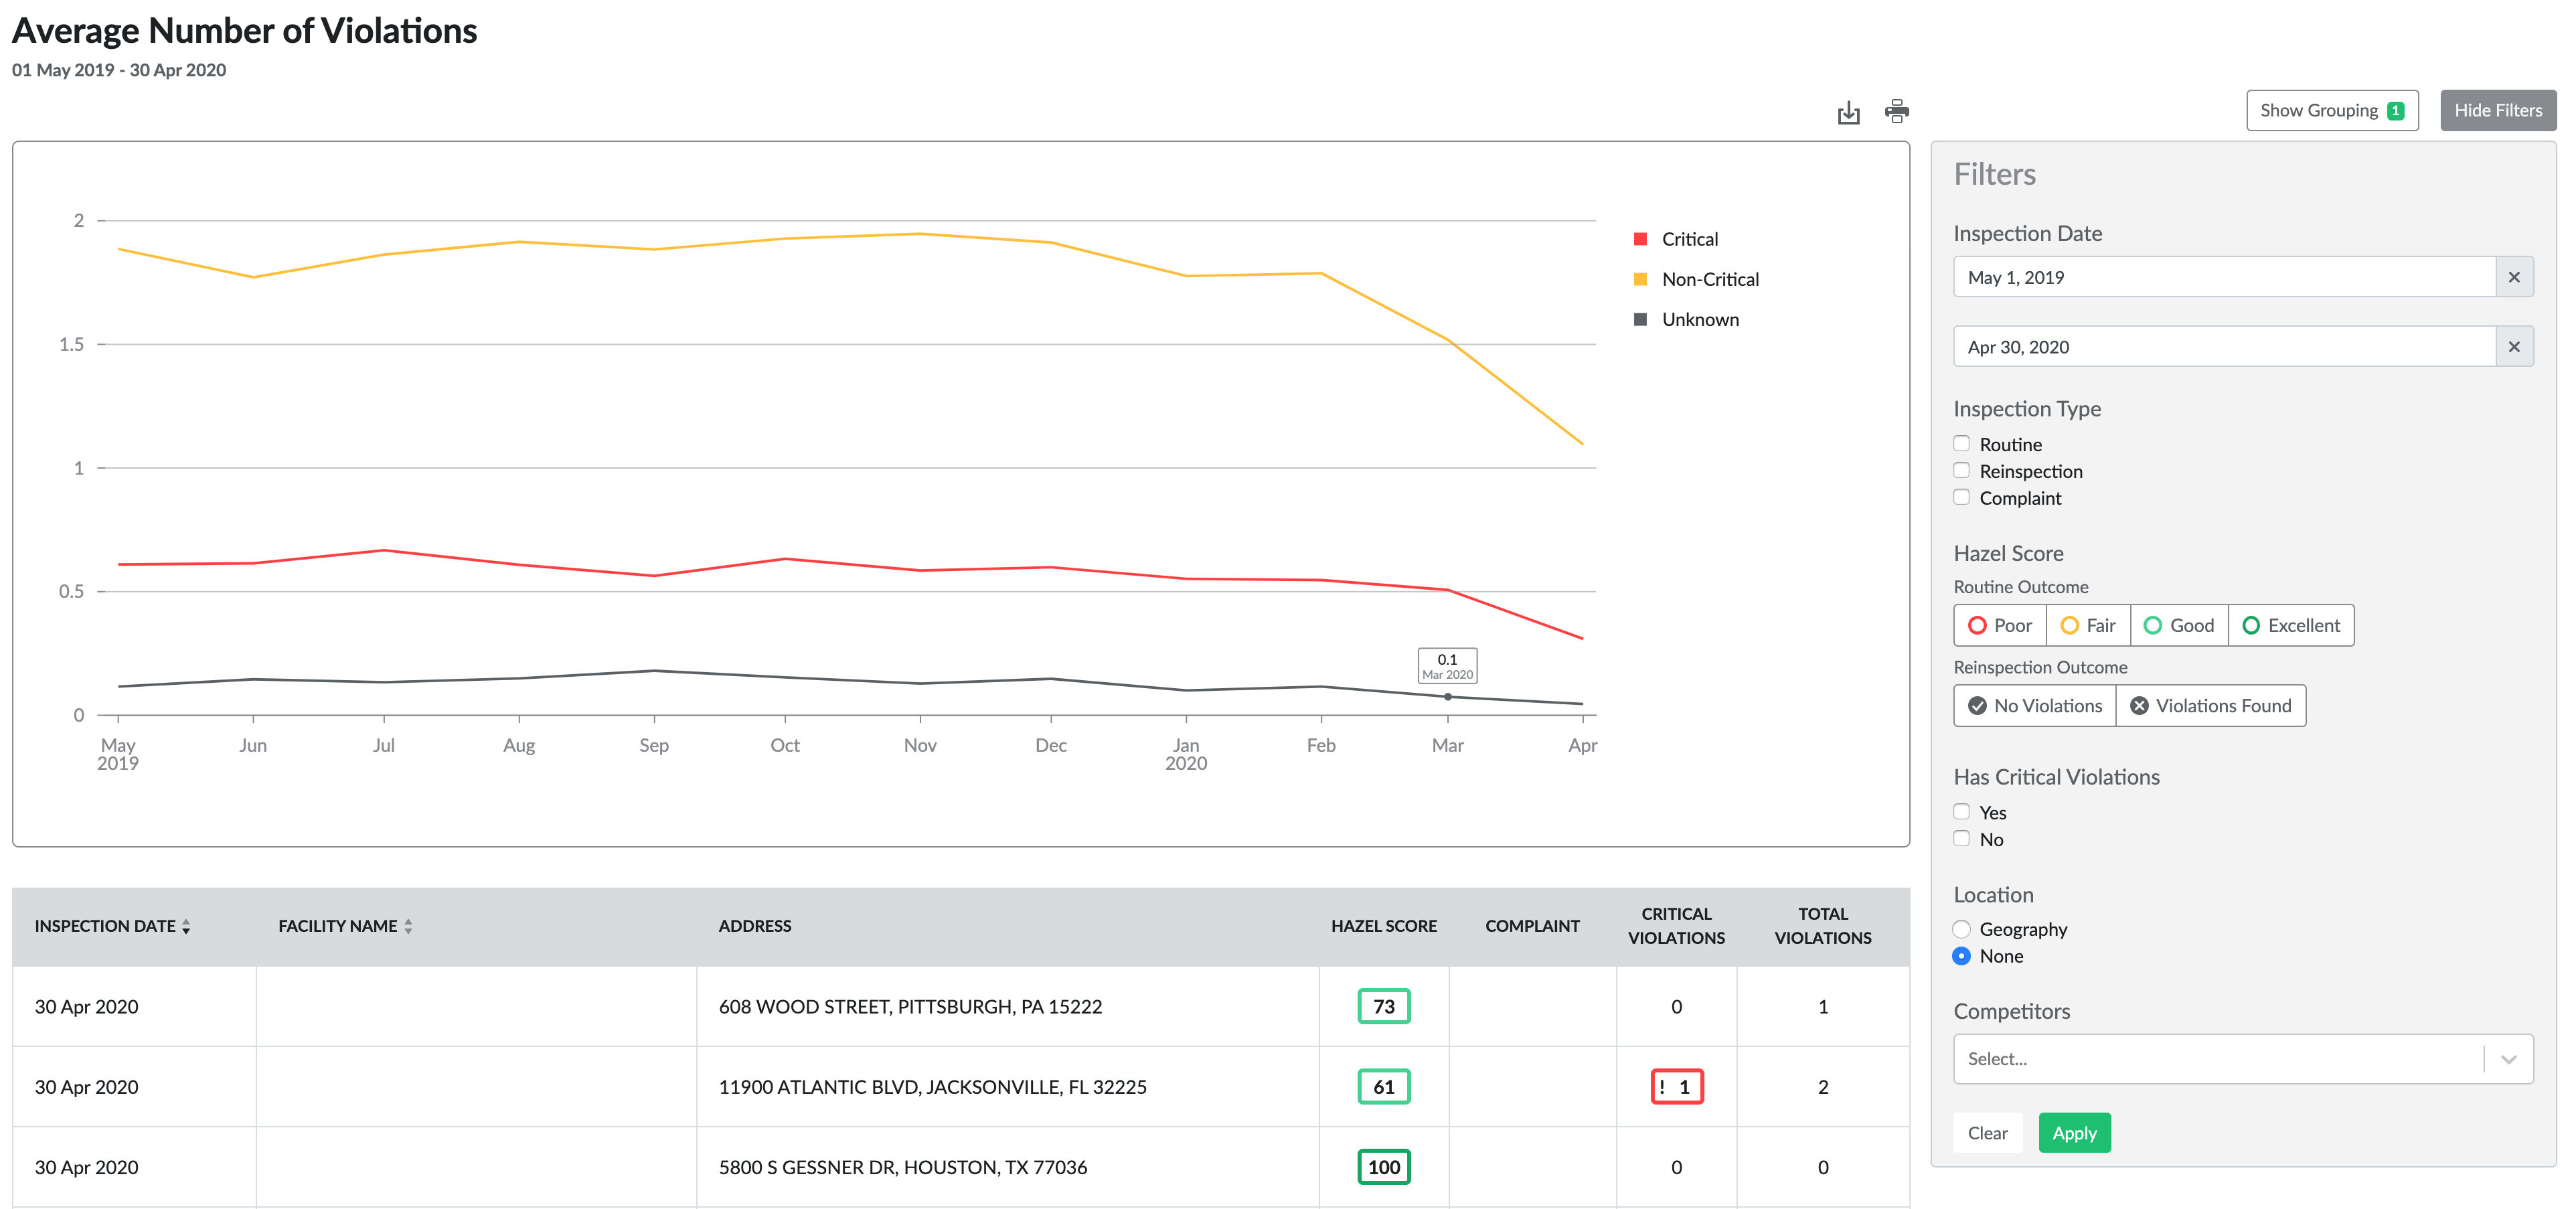
Note filtering by hierarchy is not available when a competitor data series has been added.
The data table and CSV exports
The data table shown below the chart area updates as new filters are applied, and shows all inspection data that is used in the chart visualization. You can export the data in a CSV format.
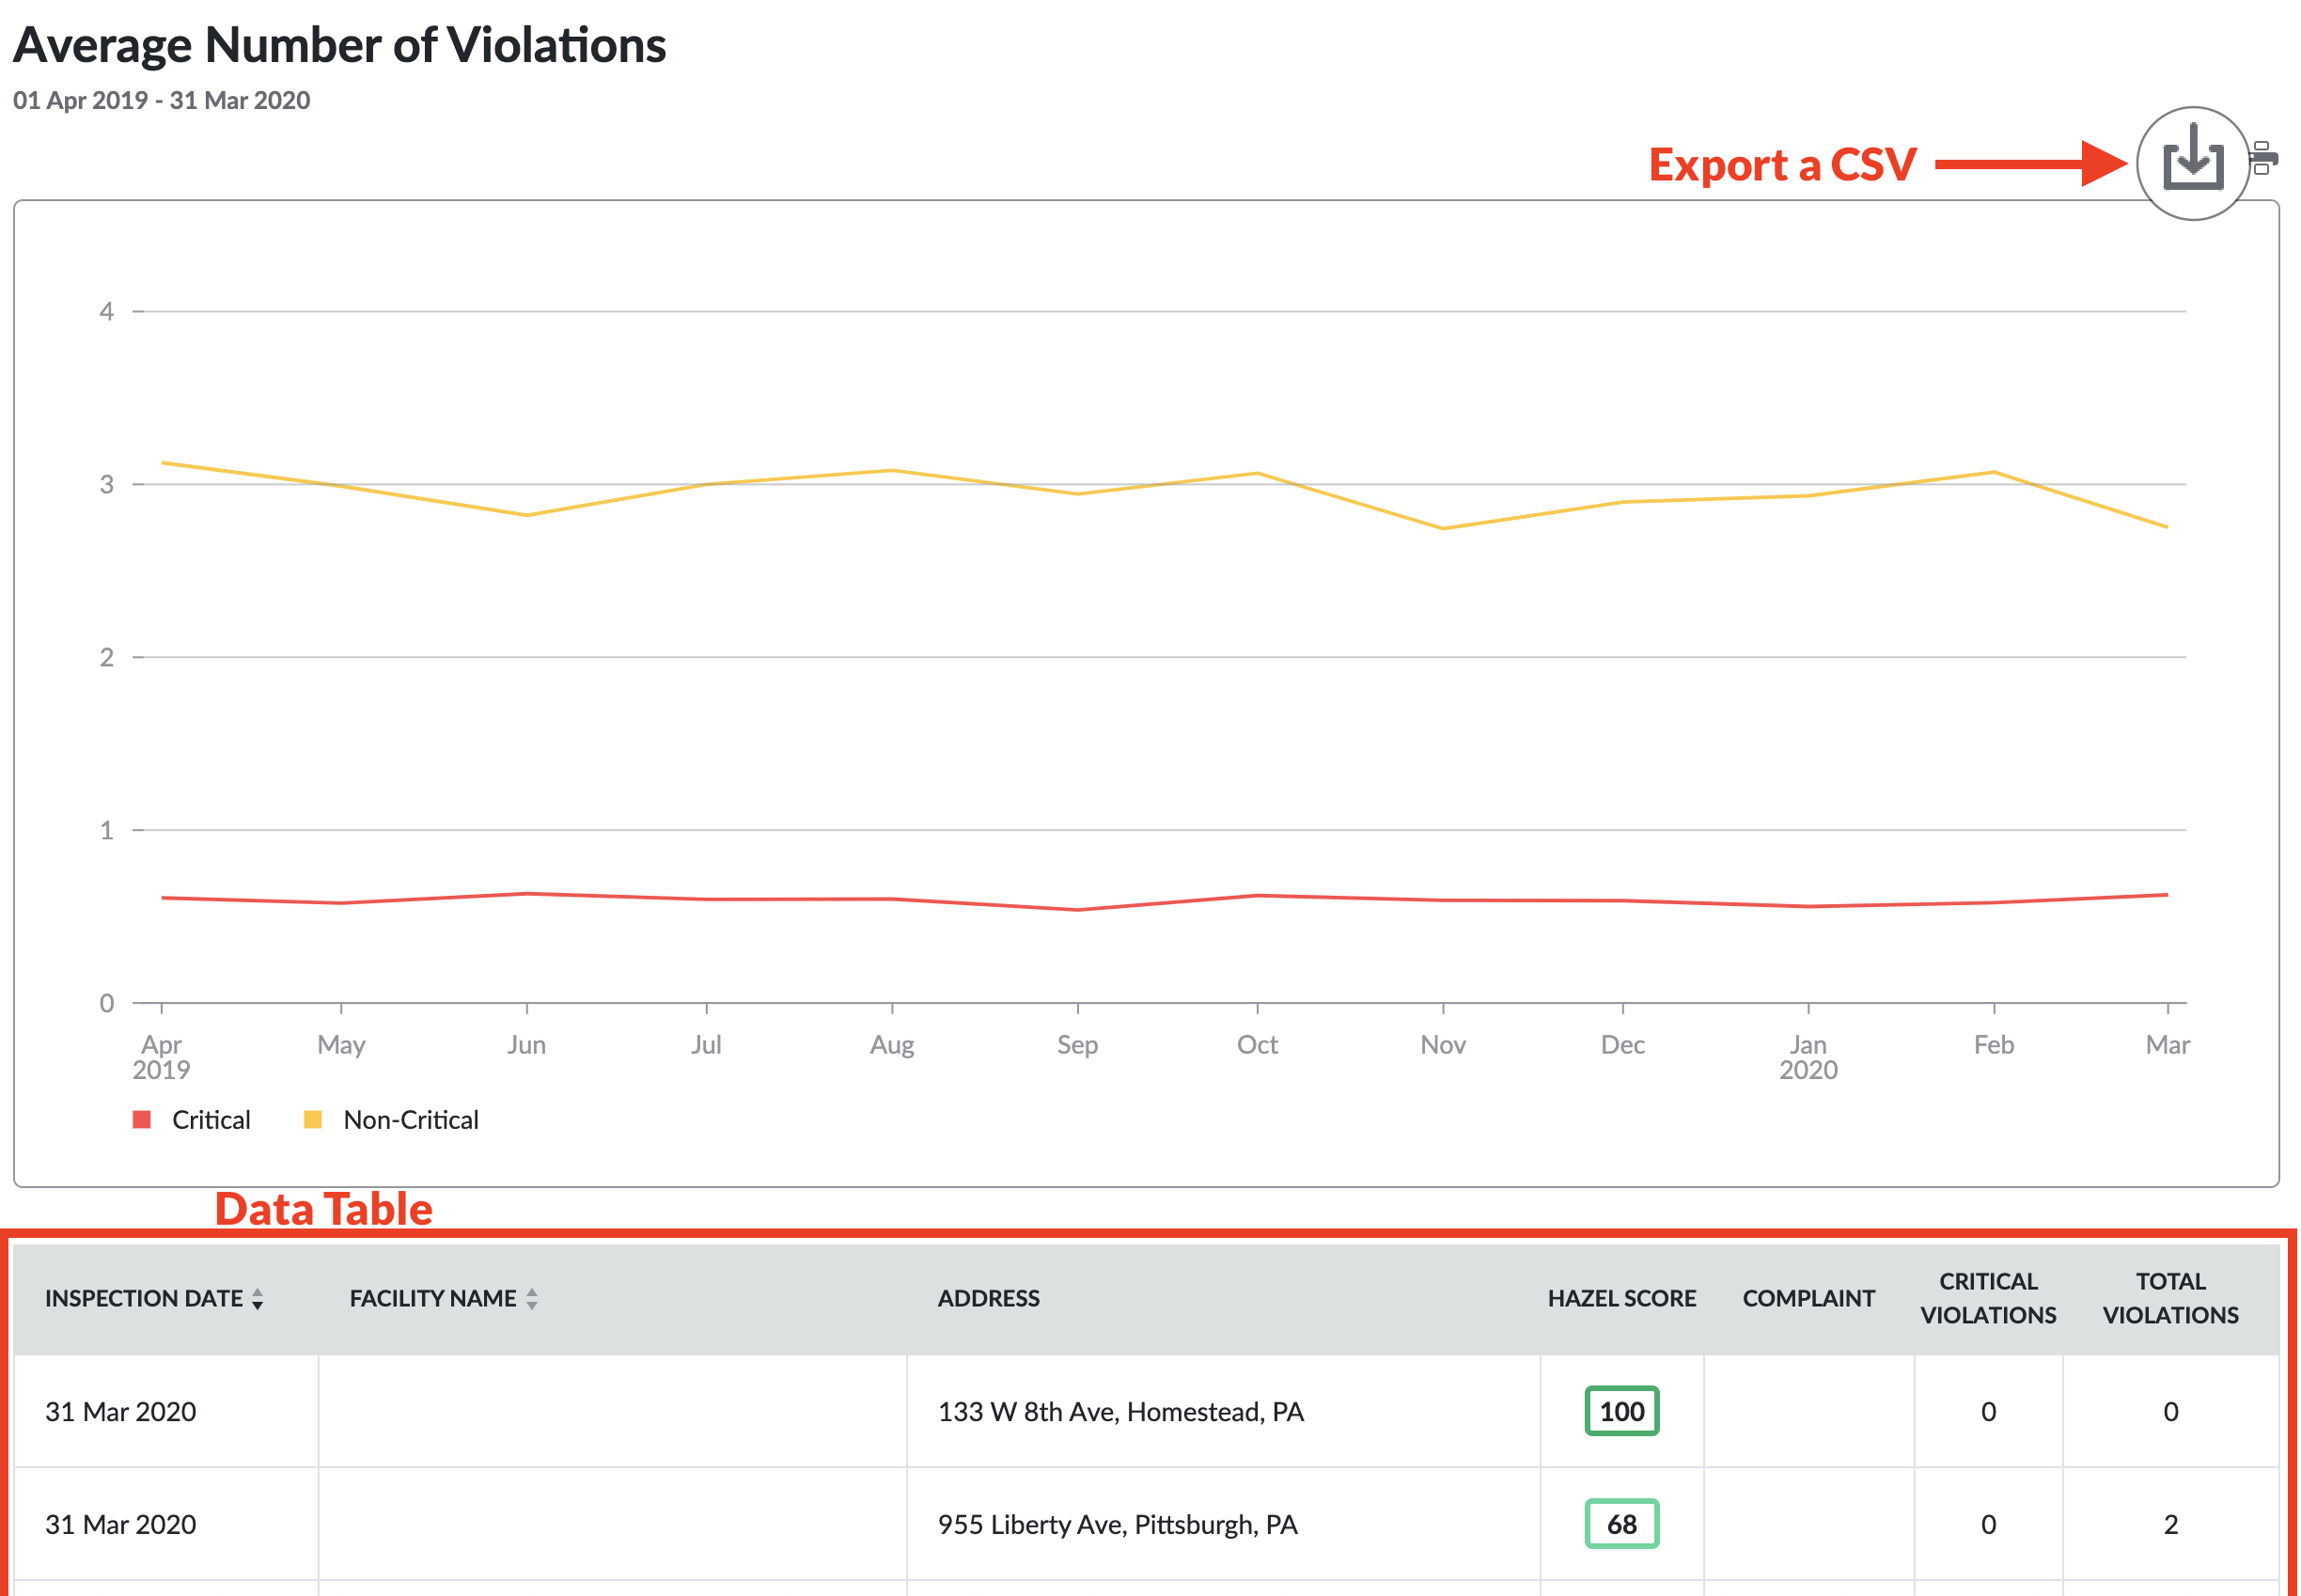
For the Average Hazel Score chart, each row in the CSV will contain a single inspection.
For the Average Violations chart, each row will contain a single violation, with attributes of that violation including criticality, Hazel category, code reference, inspection date, and inspection ID. The Inspection ID is a unique ID that allows you to see which violations occurred during the same inspection.
Note the violations CSV export only supports date ranges of 3 months or less at this time.
Interacting with the chart area
Clicking on the legend entries for a specific data series will toggle the data series active/inactive. The data table is also update to only reflect active data series.
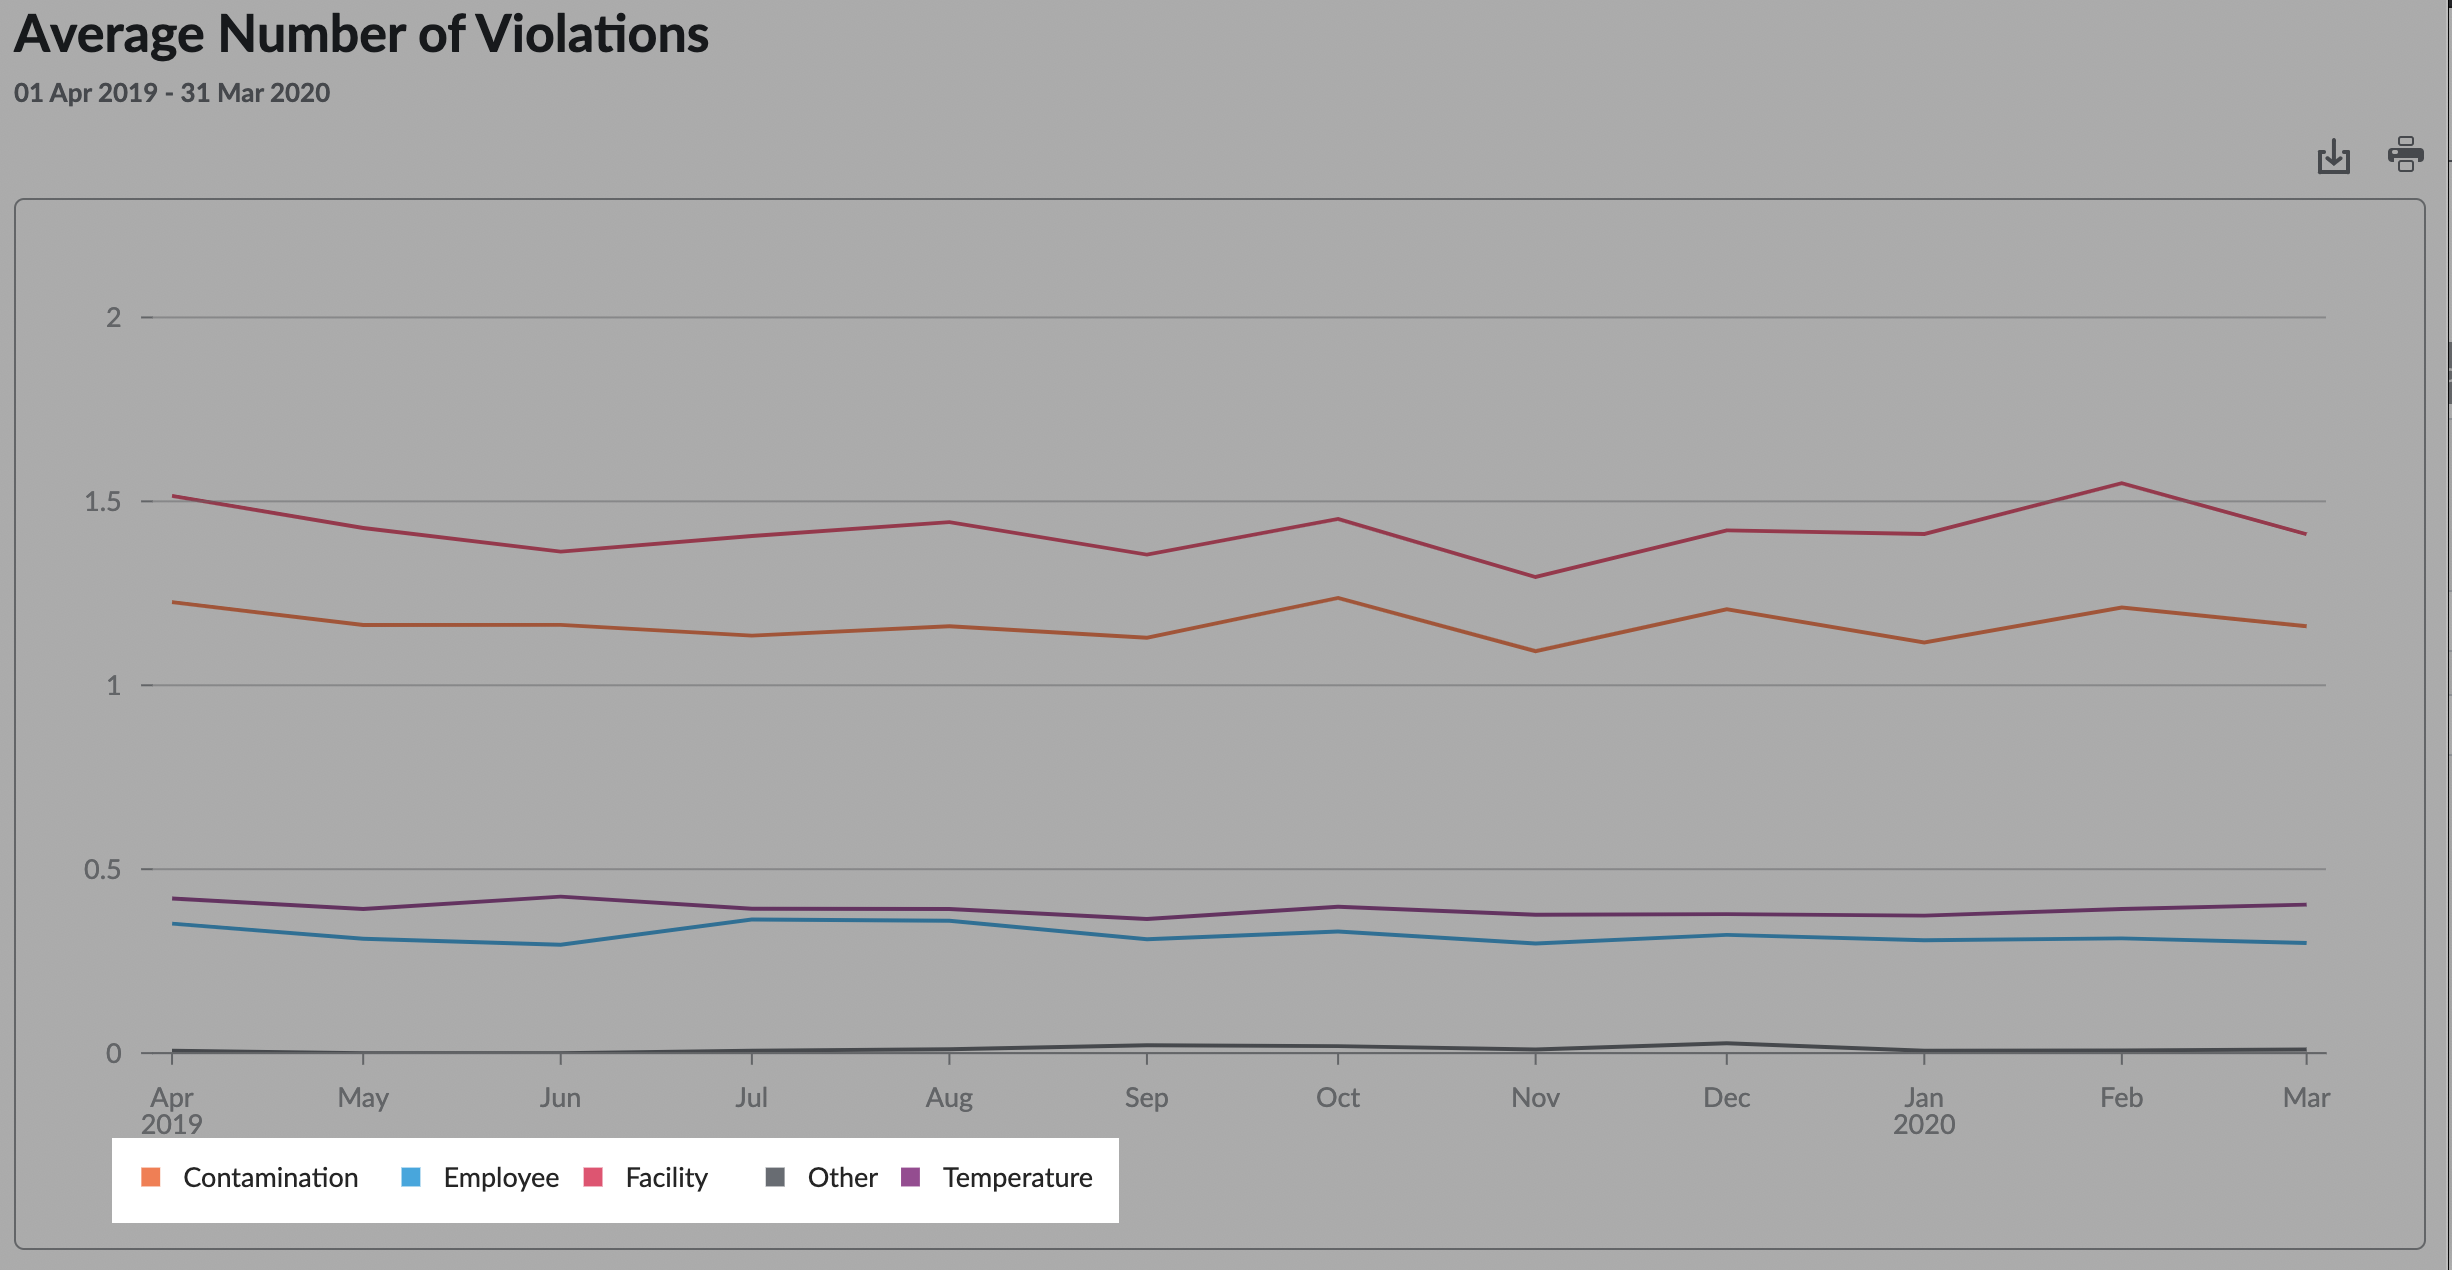
Only "Contamination" and "Temperature" data series are active in the chart below: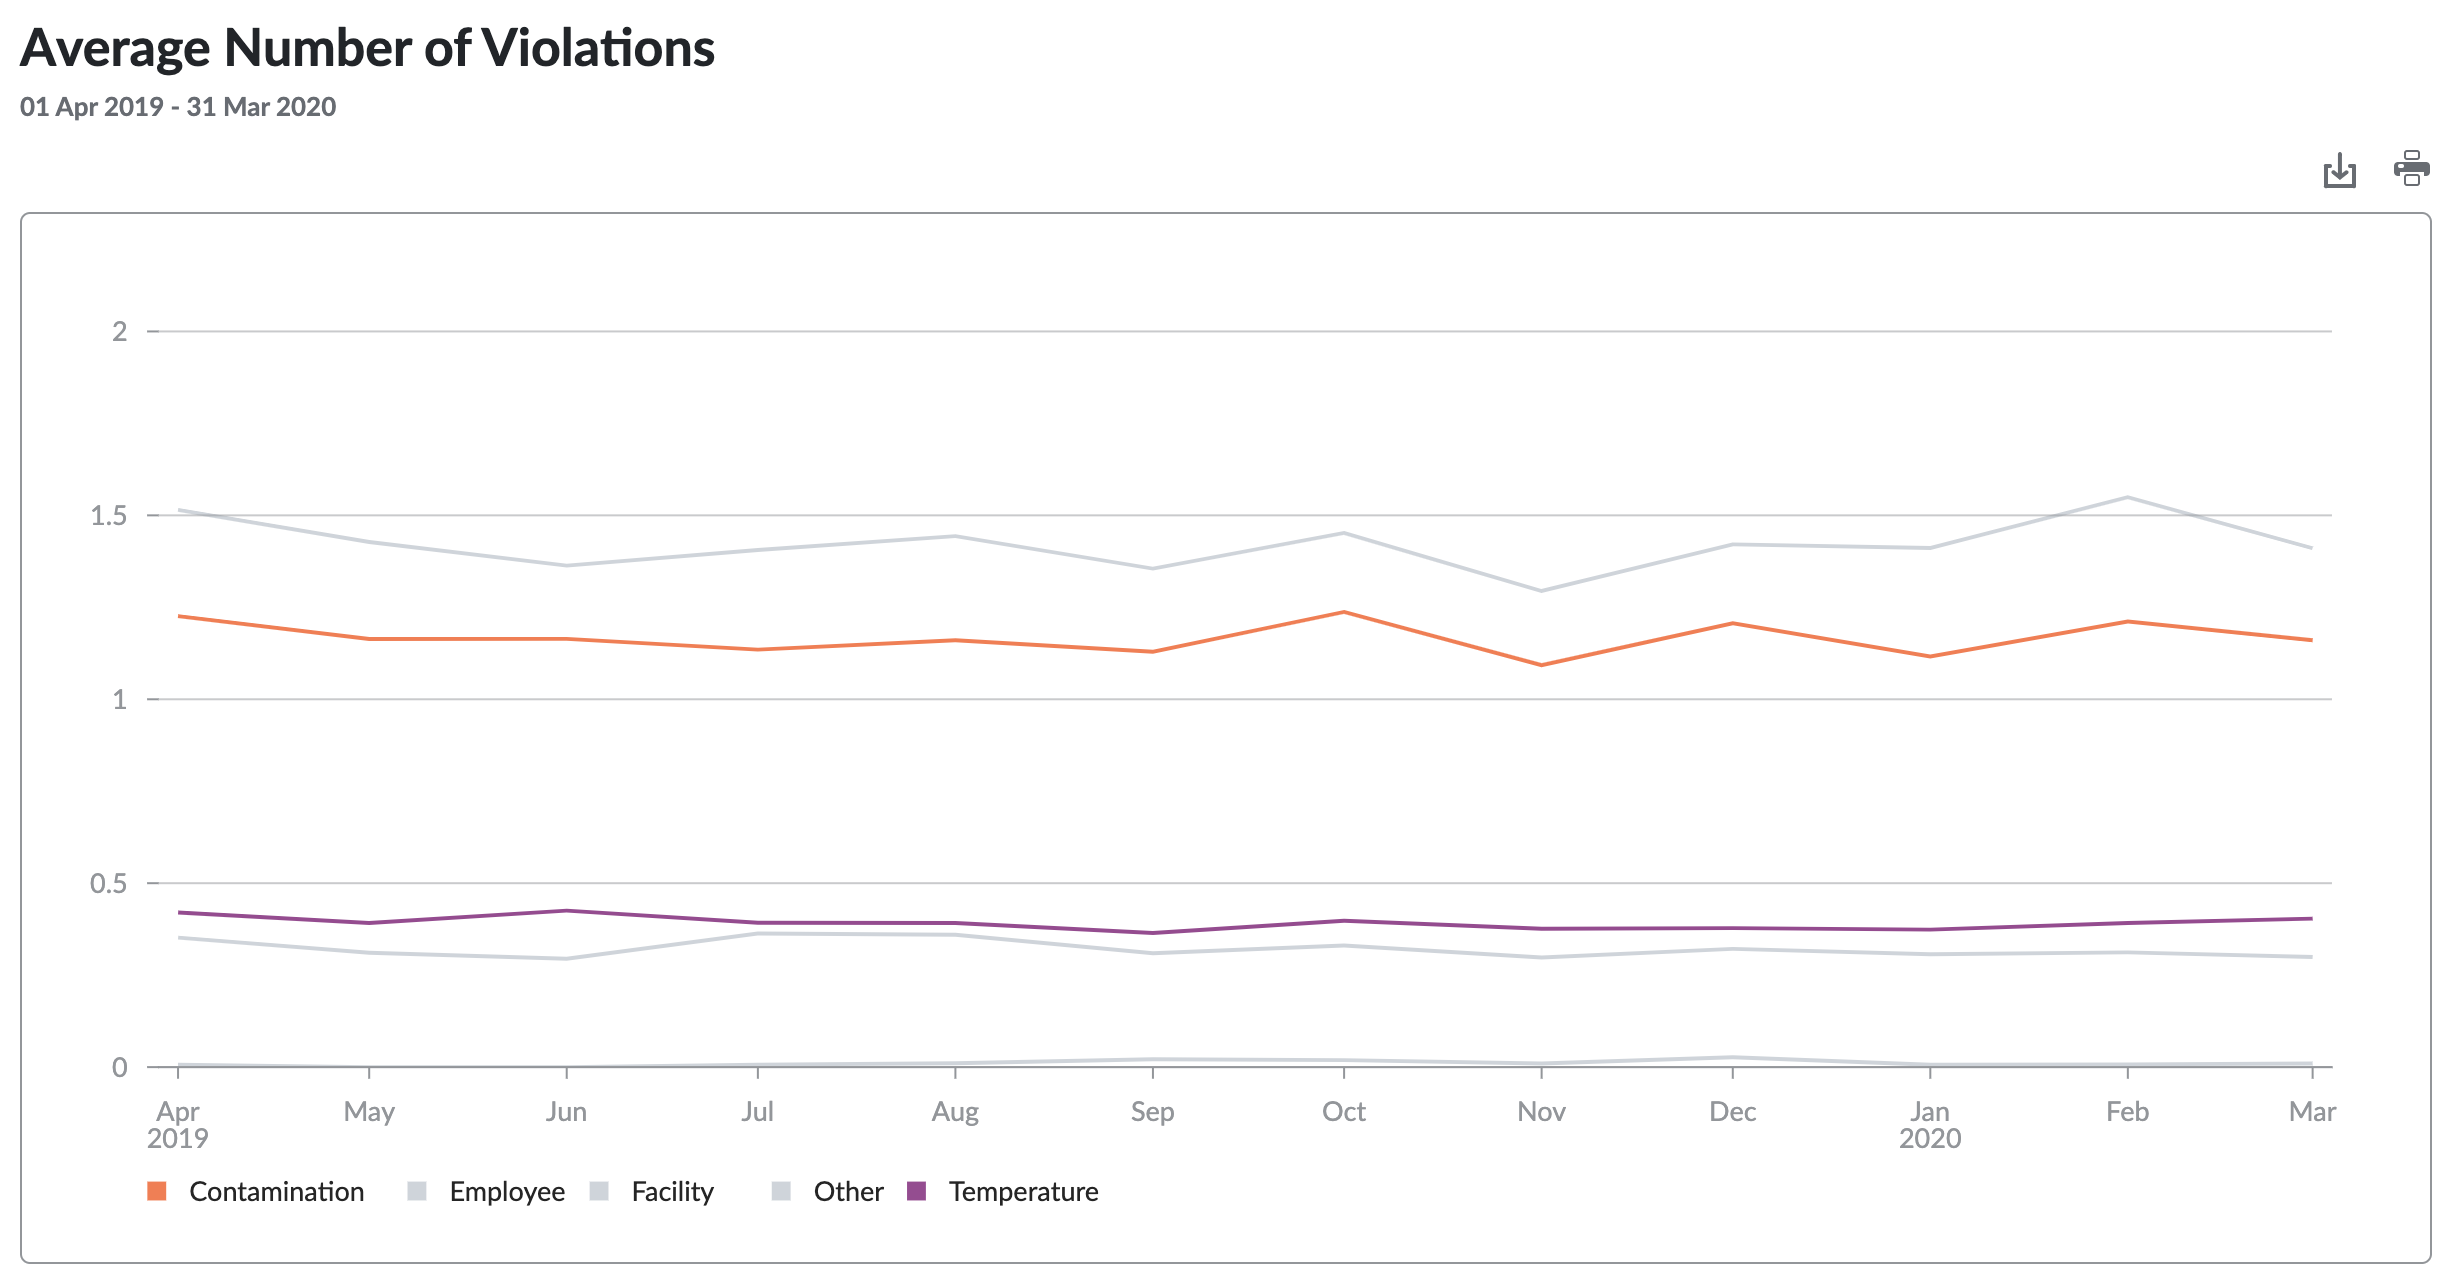
Selecting a month on the x-axis will also update the data table and CSV export, so you can slice by 1-month increments without changing the overall date range of your chart.
Returning to a previous Insight chart
The URL for a specific Insight chart can be shared or bookmarked to return to a specific analysis. The URL is updated as you apply filters and grouping options.
Currently, saving and naming Insight charts is not supported.